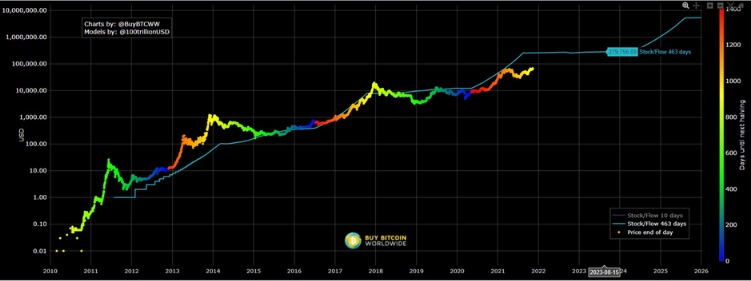
Bitcoin's Price Fortune Teller - S2FX

What if we told you that there is a model that can help you predict the future value of Bitcoin? Allow us to introduce you to the S2FX model.

But one moment before, let’s talk about the basis – Stock to flow

This is a model that helps to cross assets, based on the ratio between the total inventory of that resource and its annual production rate.

After all, everything in life is relative

Every natural element or existing commodity in the world has value. Doubling the production of Ot Wisud will significantly reduce its value, and will lead to damage to the holders and a drop in prices.

For gold for example, the annual production rate is low, the inventory is stable, so there are no drastic price fluctuations.

So let’s say Elon Musk finds a gold mine on an asteroid on one of his space flights. The production rate will increase from 1.5% to 3%. Even in the most dramatic scenario, these are low numbers that will not significantly affect its value.

Thanks to the low supply rate, and a number of other unique properties, gold establishes and preserves its monetary value over the years.

So let’s start from the beginning – who are you Stock to flow?

Stock to flow

Stock – is the existing inventory that contains the total of all existing reserves.

flow – represents the annual production cycle.

The ratio between the stock and the flow (between the inventory and the production cycle) determines the rarity of the resource and its value – it all makes sense, doesn’t it?

People also use the letter pair s\f to describe the rate of supply growth.

So pay attention when you meet the figure in different places as sf=1, it symbolizes the rate of increase in supply.

Gold’s high stock to flow ratio makes it the element with the lowest price elasticity.

Bitcoin is a commodity that is very difficult to create and requires a large amount of energy to invest in order to generate a return as a result of the mining process in the form of Bitcoin and other similar currencies.

It is not possible to fake Bitcoin production, unlike other digital currencies in which it is possible to multiply the amount and especially fiat currency type values.

And if we are talking about demand and supply, it is important to also understand scarcity, in order to understand a concept in units of measure, it can be placed on an S2F graph

Let’s look at an example –

You can see the growth rate in numbers units that are easy to grasp in order to compare to different markets and data -GOLD=62sf.

Gold has the highest supply, meaning it would take 62 years to create the same amount of gold that exists today.

Raw silver, for example, is second in the table – with a ratio of SILVER=22sf

The high ratio in the stock of these elements is what makes them monetary goods, rare and valuable!

As you know, the total stock of Bitcoin is known in advance and is about 21M BTC .

The existing inventory today stands at 18.8M coins and a supply of 0.7M with an annual increase, which makes it 25 s \f=  .

This is also what puts Bitcoin at the top of the table above.

As time passes, the power to create new bitcoins weakens and the reward for solving the mathematical puzzles becomes smaller.

On average, every 10-11 minutes a block is closed in the blockchain network containing the reward in the form of currency and the fees paid by users of the network in order to transfer coins for different uses.

Every 210,000 blocks (on average every 4-5 years) a Bitcoin Halving occurs.

Crossing is an exciting and important event among veterans of the network and holders of the currency, and is one of the main influences on the price of Bitcoin for a simple reason:

If at the time of the crossing event the production rate is reduced by half, that is, the flow is reduced by half, then the s/f ratio increases by 2 times and therefore the value of the coin increases and so does the s/f after each crossing.

Simply put, the person who suffers from inflation is the creator of the currency and not the user.

And in economic terms , a process called ” monetary inflation ” will happen .​​​

The data collection for the graph started from 2009 and continued until July 2010 where for the first time the ongoing documentation of the price of Bitcoin began from then until today.

The graph includes all the crossing events that took place and the change they created in the existing inventory against the recorded cycle.

“The most important thing in science is not necessarily to obtain new facts, but to discover new ways of thinking with the existing facts”

S2fx – also known as Btc stock to flow

Bitcoin is the first digital currency and store of value the world has seen.

It is as rare as silver and gold and can be transferred via the Internet, radio and satellite transmission.

The model allows the evaluation of various assets such as gold, silver, precious metals and bitcoin.

Bitcoin has transitional stages that it had to go through in order to reach where it is today, and to reach in the future where we are all waiting – to become the global store of value.

Transitional stages exist in the elements of nature and also in changing global currency of any kind, for example:

Water – the transition phases of water can be solid, liquid, gas, and ionized.

From the beginning of its journey, Bitcoin went through a series of accumulation states, which helped it establish itself as a global world currency and a store of value.

If we accept this process with financial milestones, these are the steps that need to take place –

  1. Proof of concept – after the publication of the Bitcoin white page .

2.Payments – after comparing 1 dollar to Bitcoin 11USD=1BTC E-GOLD. 3 – After the first Bitcoin crossing, the price of 1 Bitcoin equaled the price of 1 gram of gold.

  1. Financial Asset – after the second bitcoin crossing and a daily transfer cycle of more than a billion dollars. Along with the regulation in Japan in Australia, and adoption by other countries, alongside the joining of futures markets (CME).

Understanding the stages of recognition and legality of Bitcoin requires an open mind. Just as we look at a change in shape in water, or a change in the dollar coin from its birth to the disconnection from Megba (gold).

In the following graph you can see the four steps we have discussed so far, combined with the price movement data placed on the model.

This data specifically describes the volatility of the Bitcoin market value and its price.

To broaden the perspective, we will place on the graph data of other assets such as silver and gold for example (the precious metals that hold most of the world’s capital).

In this way, the graph can be turned into a real model that crosses assets.

You can update the data of the S2FX graph in real time on the BA website .

The chart shows the previously mentioned data clusters, plus the data for silver and gold. It can be seen that they create a straight and perfect line in an almost exact correlation to create the S2FX model.

The S2FX model shows a direct relationship between the S2F graph and the market value of these six benchmarks.

The model predicts that when the total supply of Bitcoin reaches 19 million BTC, the expected price of one Bitcoin will reach $288,000, between the years 2021-2024.

Of course, looking into the future and using past data is a common assumption.

Many analysts predict lower/higher prices. PLANB  stands by its opinion and stands by the forecast throughout the year 2021 when its report receives massive sympathy from the world’s largest holders and economists.

Future research can also focus on adding additional assets to the analysis, but treating them as a value is a bit problematic for the purpose of comparison. For example diamonds – their value is high, but their value is measured according to main influencers:

The carat, the different colors, the polish, the roughness or the shape of the cut.

So what awaits us in the future ?

This article presented the order of operations through which the S2F model was built and upon which the renewed model was built that adds Bitcoin to the list of underlying values.

This graph removes the time dimension, and places additional properties on the graph. The model allows for the evaluation of various assets such as silver, gold, and bitcoin by placing them on a portfolio .

The concept of these transitions led to a completely new way of thinking and that is S2FX.

The accuracy of the model currently stands at 98.7%!

The model estimates Bitcoin at the following benchmarks at a market value of $5.5 trillion, when as of October 2021 it stands at approximately $2.2 trillion.

In the S2F units, it is expected to reach S2F-56 between 2021-2024.

This data translates to an estimated Bitcoin price of $ 288K !

Here is a link to a video that explains in detail about the key to the model and how to use it to look through the model at the state of the Bitcoin market.
https://www.youtube.com/watch?v=xmrDqdy3Lgw

In conclusion

With the help of indirect and macroeconomic research, it is possible to formulate research facts with the help of the S2FX graph, and get a new perspective towards the transition to the fifth stage.

referents-

https://medium.com/@100trillionUSD/modeling-bitcoins-value-with-scarcit y-91fa0fc03e25 https://bitcoin.org/bitcoin.pdf

https://medium.com/@100trillionUSD/modeling-bitcoins-value-with-scarcity

y-91fa0fc03e25

Tagged crypto


Share this

rELATED article

?Stable coins VS Unstable banks

?Stable coins VS Unstable banks The last weekend showed how much can happen in a small blink of the market. Where does it all start?

The Grandpa Crashing the NFT World

Summary of the First Webinar of 2024: Bitcoin 10KTF Project Review   In this article, I will present to you the 10KTF project, which is

Tell us a bit about you

We’ve ❤️ put content that you’ve loved. Join us for live channels and updates.